barplot
매개변수
main = ' ' : barplot 제목
xlab = ' ' : x축 변수명 설명
col = '~' : 막대 색
axes = F : 축 미표시
names.arg = : x축 변수명 표시
tip. row.names() or colnames()로 쓰기
beside = T : 행렬 데이터 때, 두개로 구분 + space(0.1,2) 같이 활용할 것.
xlim = c(0,5) : x축 길이 조정
ylim = c(0,5) : y축 길이 조정
horiz = T : 막대 가로로 표시
Horizon barplot

#기본적인 막대도표 그리는 함수
barplot(c(15,12,5),
        names.arg=c('G3','G4','G5'),
        main='car distribution',
        xlab='the number of gears',
        ylab='Frequency',
        col='skyblue',
        horiz=T, las=2)
barplot using legend

#범례 legend를rownames!
counts <- table(mtcars$vs, mtcars$gear)
barplot(counts, legend=rownames(counts))

#범례에 직접 0,1 입력
barplot(counts, main= 'Car ditribution', legend=c(0,1),
         ylim=c(0,20), col=c('darkblue','red'))
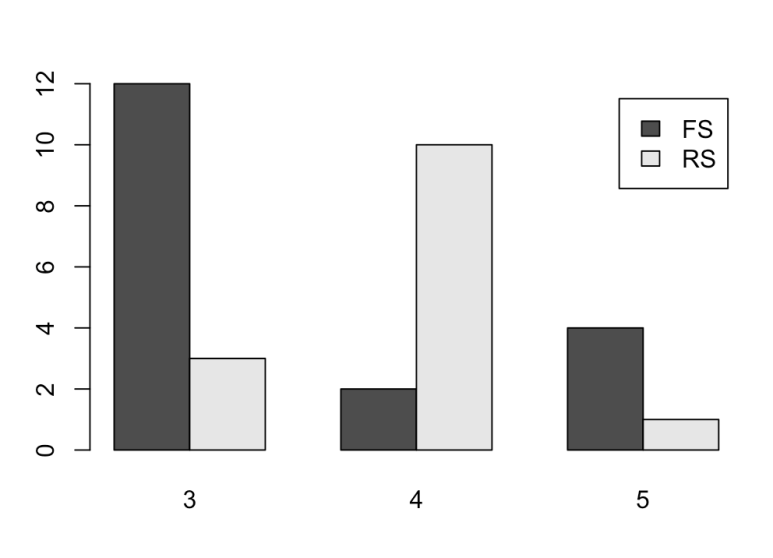
barplot using legend (beside=T)

#beside= T : argments 분리 , #cex.names=3 : x 크기 조정
barplot(counts, legend=c('FS','RS'),
        beside=T)
barplot using text

#show Frequency
b1<-barplot(c(15,12,5),
        names.arg=c('G3','G4','G5'),
        main='car distribution',
        xlab='the number of gears',
        ylab='Frequency',
        col='skyblue',las=2,
        ylim=c(0,18))

text(b1, c(15,12,5)-0.5,
     labels=c(15,12,5))
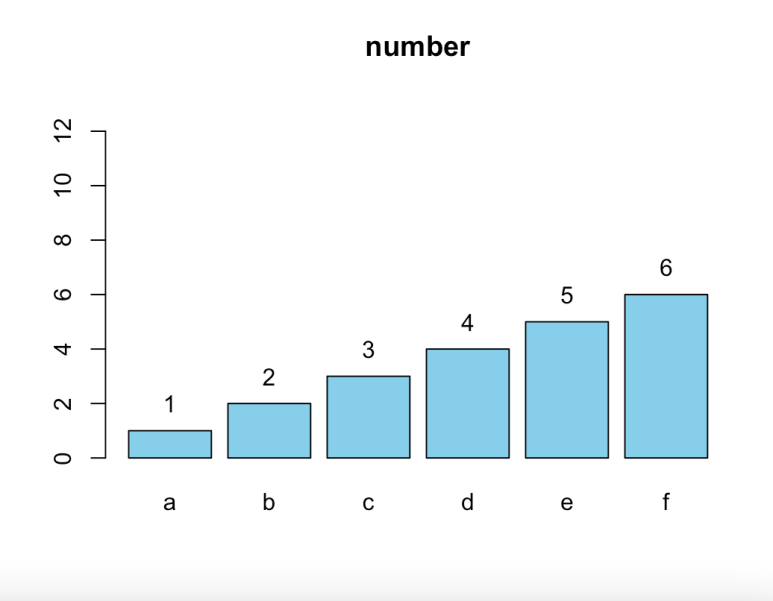
barplot using text #2

apt <- c(1,2,3,4,5,6)
barp <- barplot(apt, names.arg = c('a','b','c','d','e','f'),
                main='number',
                col='skyblue',
                ylim=c(0,13))

text(barp, apt+1, labels=apt, col='black')
barplot color with space

barplot(c(15,12,5),
        names.arg=c('G3','G4','G5'),
        main='car distribution',
        xlab='the number of gears',
        ylab='Frequency',
        col='skyblue',
        space=c(1,1,1), #막대 간 거리
        border='red') #겉 색상
barplot minus plus values

#X,y graph
x<-seq(-5,5)
y <-ifelse(x>0,'red',NA)
barplot(x,col=y)
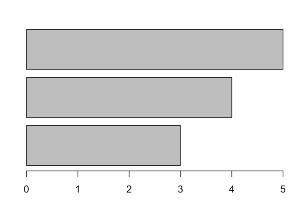
barplot using rev function


#left
oecd<- c(3,4,5)
barplot(oecd, horiz=T)

#right
oecd <- rev(c(3,4,5)) #reverse numbers
barplot(oecd,horiz=T)'R' 카테고리의 다른 글
| R - [Normality] (0) | 2022.12.25 |
|---|---|
| R - [Visualization. ggplot2] (0) | 2022.12.22 |
| R - R Markdown command (1) | 2022.12.22 |
| R Visualization - [boxplot] (0) | 2022.12.06 |
| R Visualization - [dotchart] (0) | 2022.12.06 |